Video Tutorial
Originated from TogoTV.
Switch the Organisms
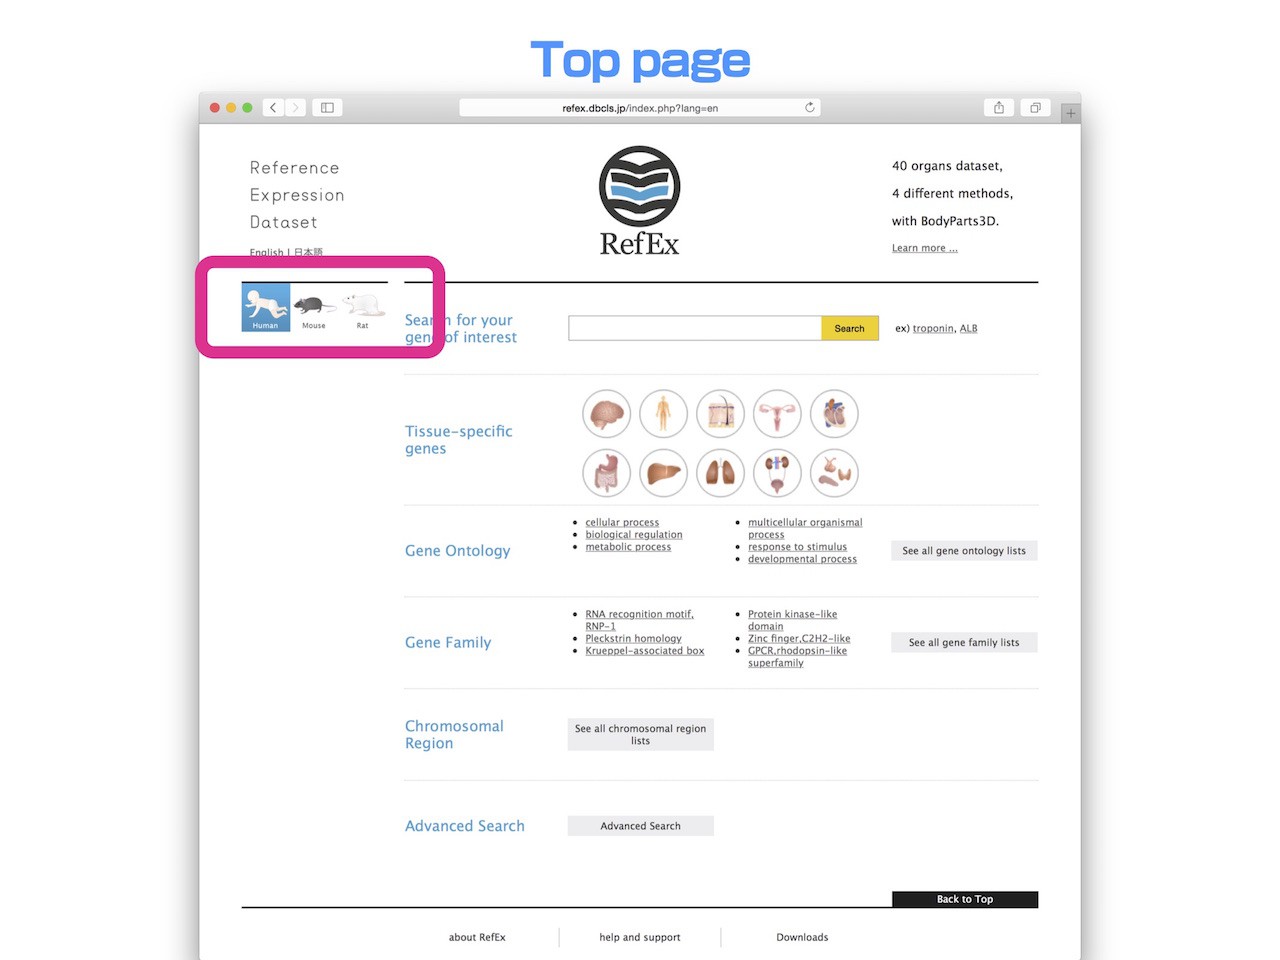
- In RefEx, you can search genes from the dataset of human, mouse, and rat. In order to switch the dataset, click the icons here (point the rectangle).
Incremental Search
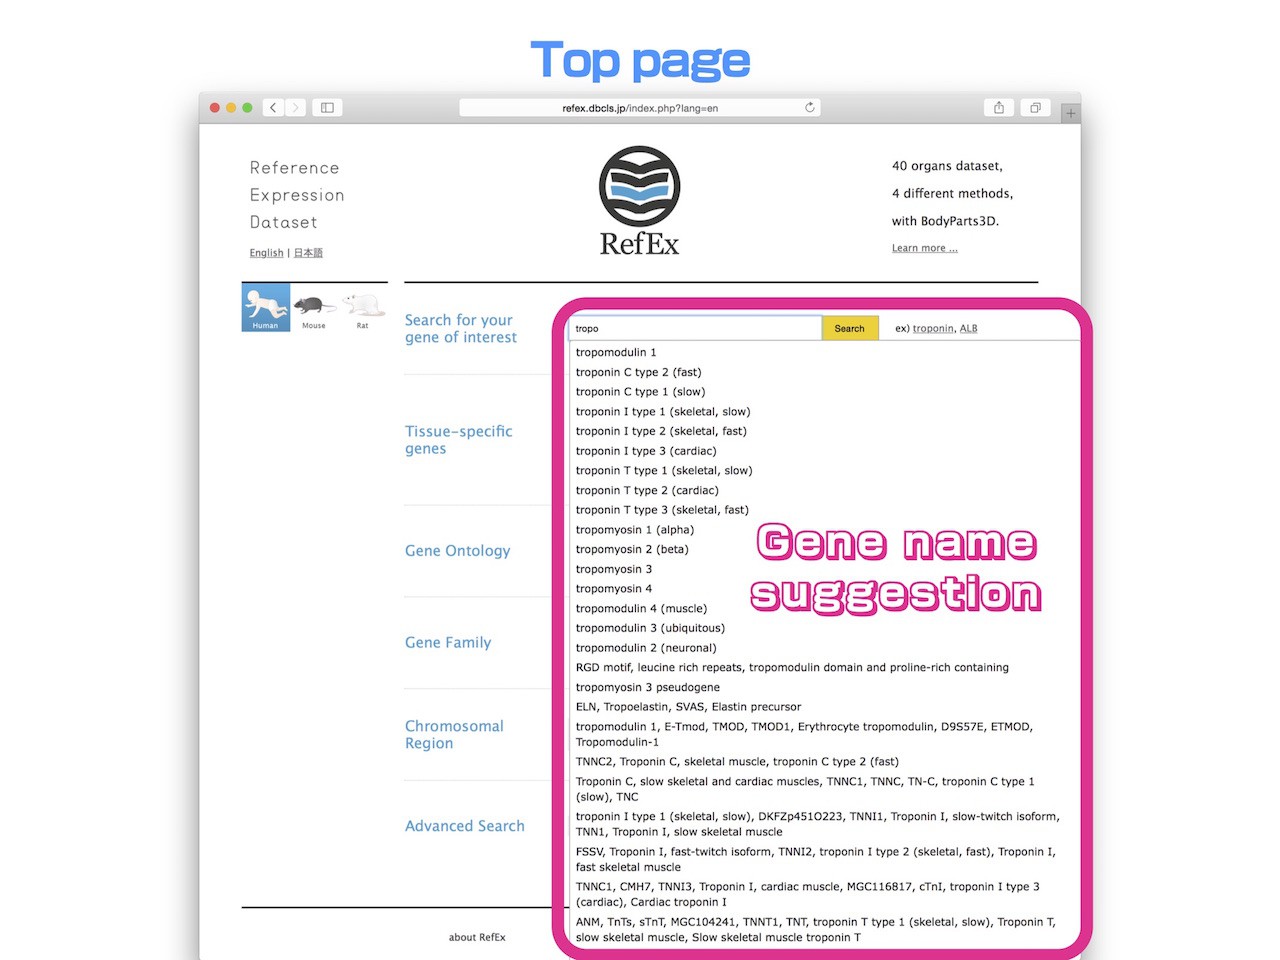
- RefEx provides incremental search for gene name or gene symbol of your interest. When you enter 3 or more characters of the keyword, candidate containing the term will be suggested. You do not need to type the exact full name of the gene.
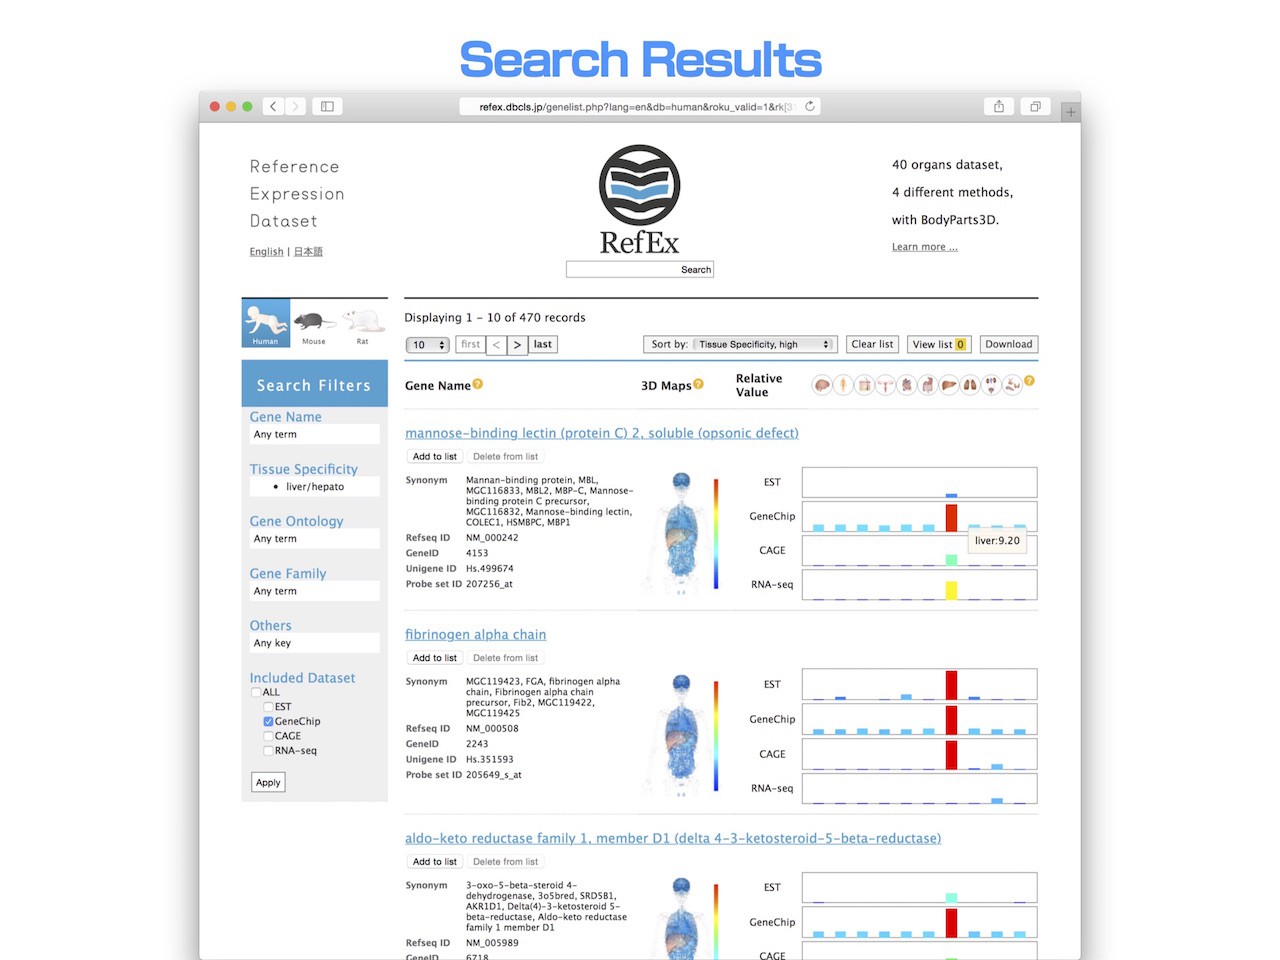
Search Results
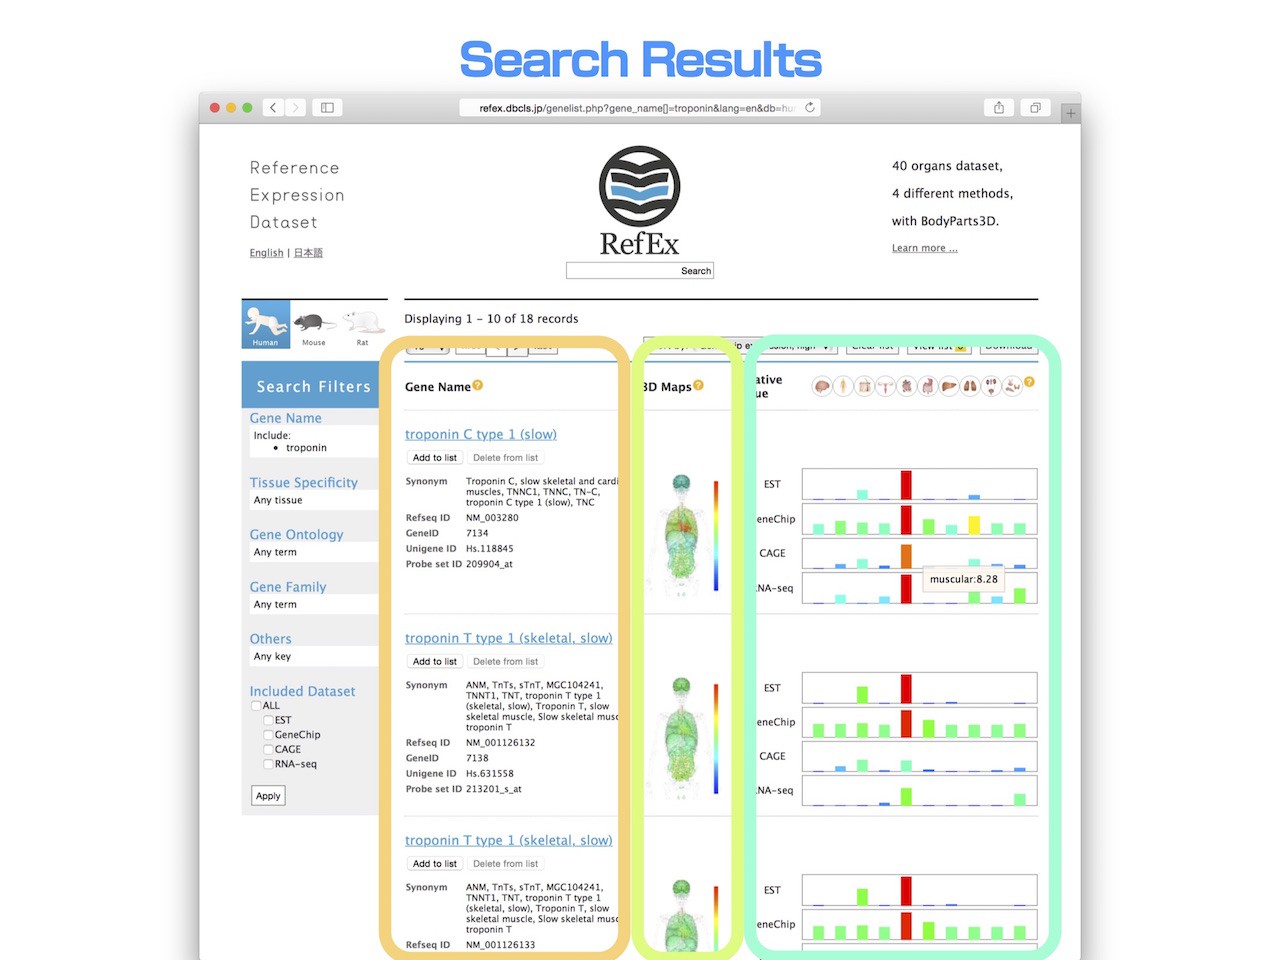
- After the search from the top page, you will move to the "Search Results" page. Here, 18 search results for "Troponin" are retrieved.
- On the left, various annotations are displayed in addition to the gene name.
- On the center, heatmaps of expression pattern are displayed in the 3D model of human body.
- On the right, the relative expression values in 10 major groups of normal tissues for each type EST, GeneChip, CAGE and RNA-seq are shown.
- The name of the tissues will appear when you mouse-over the icon of the tissues. Value of the expression level will be displayed when you mouse over the bar chart.
- When you click the gene name, you can move to the detailed information page.
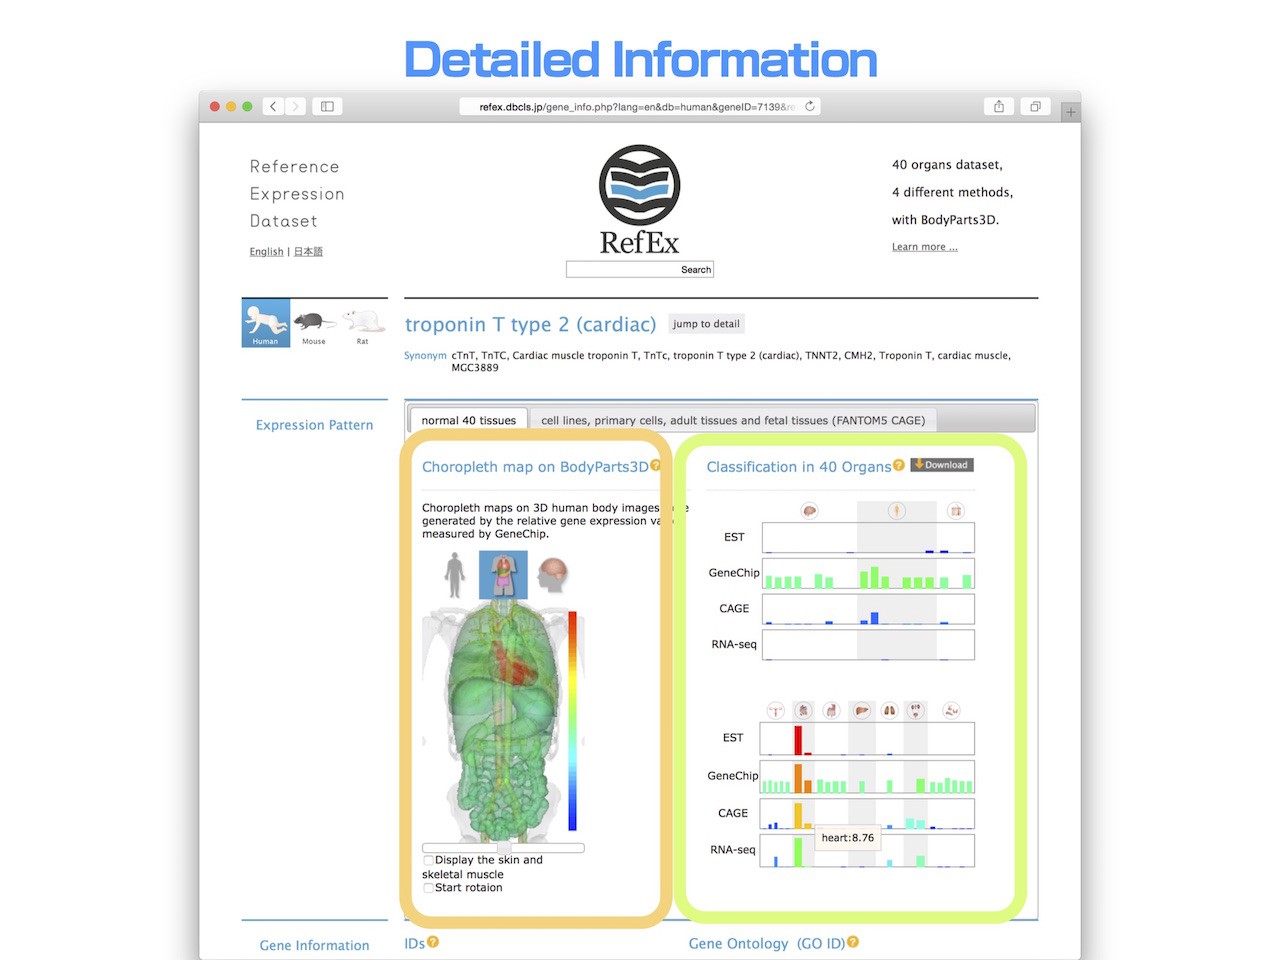
- Relative gene expression values are shown in RefEx as choropleth maps on 3D human body images from BodyParts3D
- In this example, because it is the cardiac muscle-specific gene, you can see that it is highly expressed in heart. This type of visualization can help users understand the differences in gene expression patterns among tissues more intuitively.
- On the right, the relative expression levels in 40 types of normal tissue that have been more precisely classified are displayed.
- In the classification of forty tissues, an example of troponin T type 2 is shown to be a high expression level in heart among other muscle tissues.
- In addition, when comparing the RNA-Seq and GeneChip, you can see also the difference in the background expression level by experimental method.
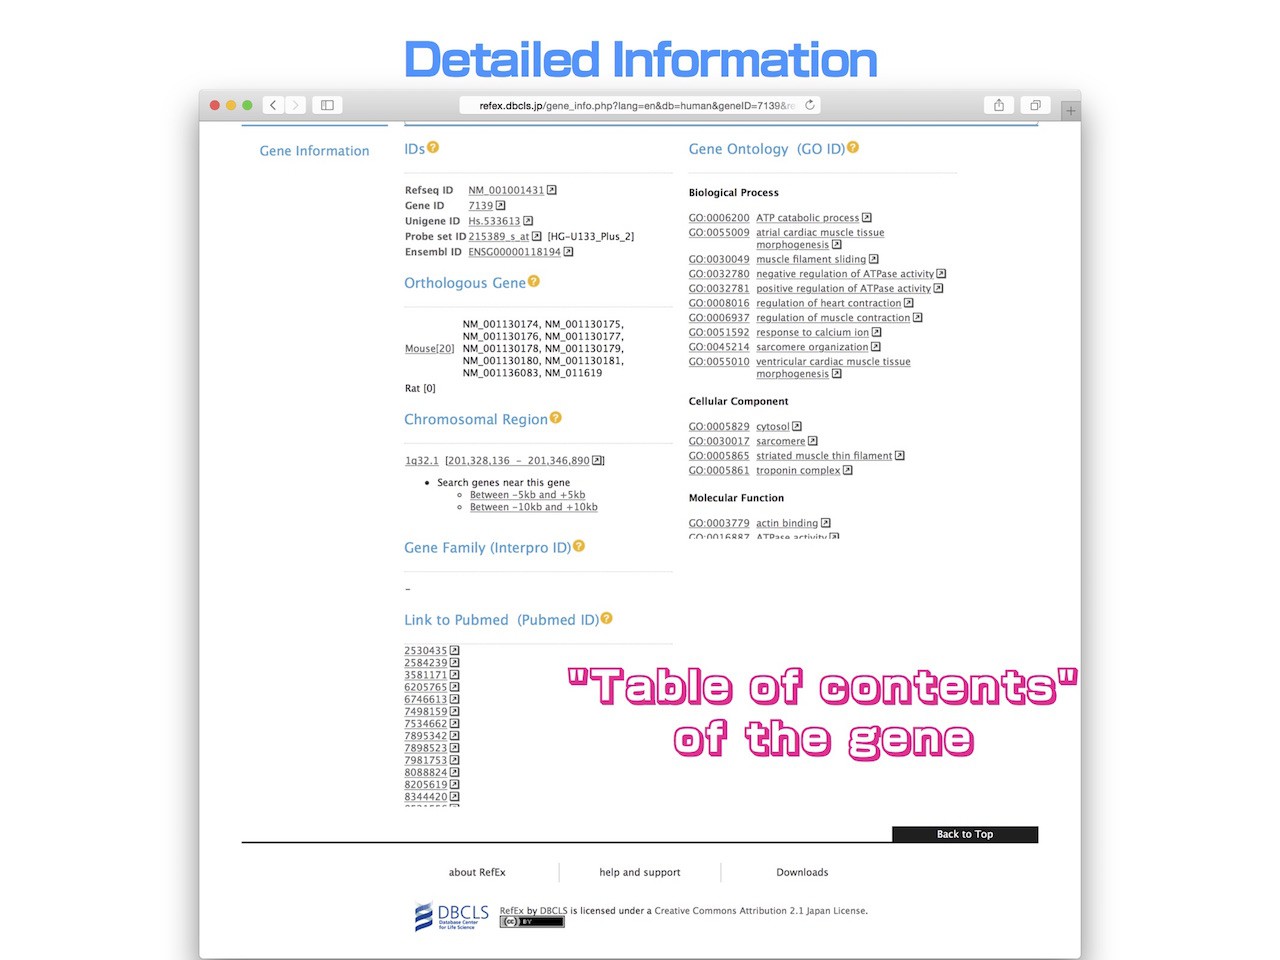
- When you move to the bottom of the "Gene information", various annotations and their external links are listed. It can be used as a "table of contents" of each gene.
FANTOM5 CAGE Viewer
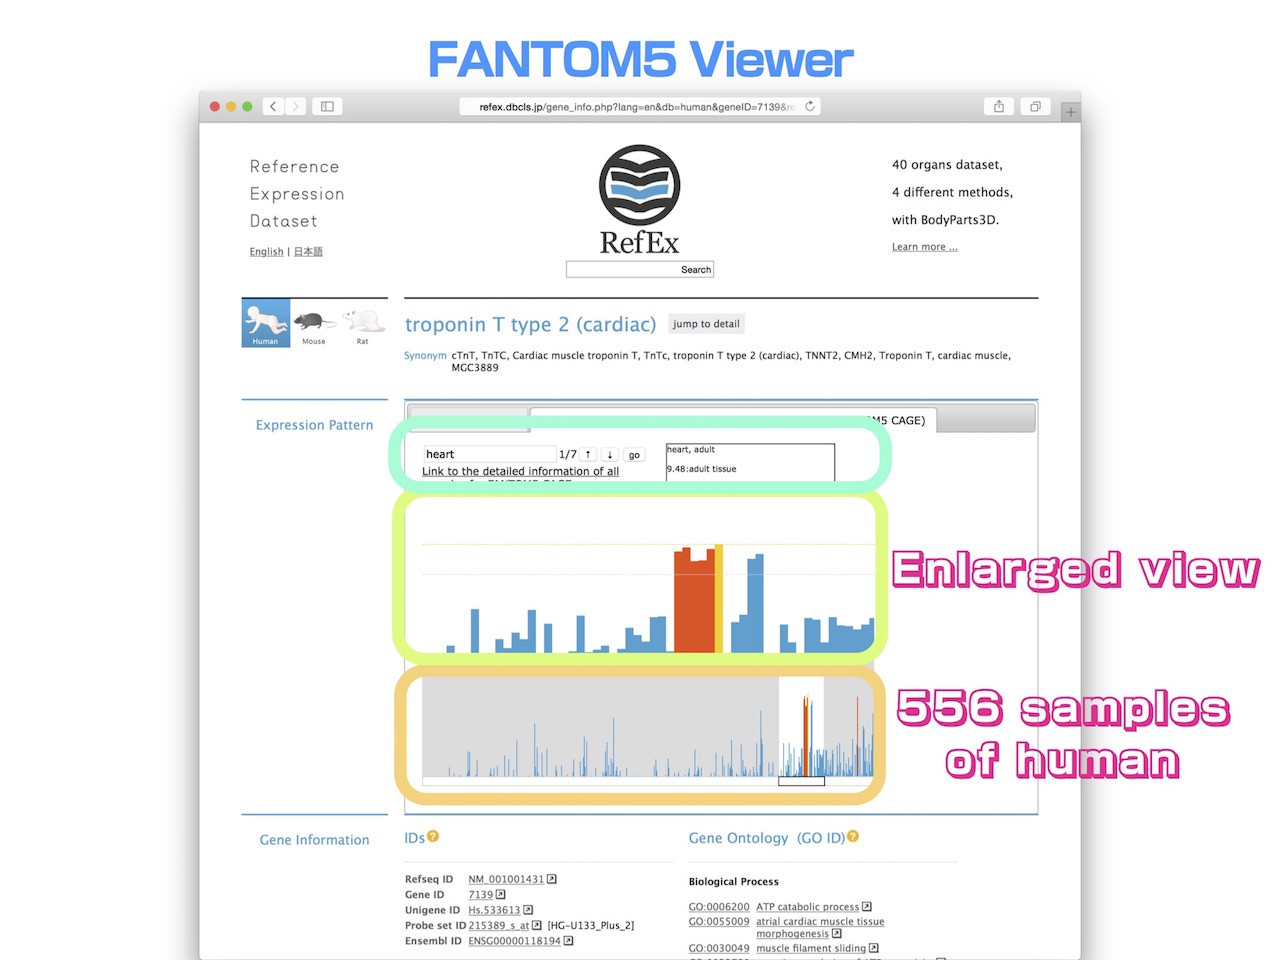
- By clicking the right-side tab users can switch to a FANTOM5 CAGE data viewer.
- This viewer shows the expression patterns of all the samples in the lower screen, and displays an enlarged view of a specific area in the upper screen.
- Because this representation is the expression profile for humans, 556 samples are shown in the bar chart in the lower screen. This way a user can see the overview expression pattern of all samples.
- The area displayed in the enlarged box can be moved freely by dragging.
- When a user enters a keyword in the search window of the viewer, the sample name containing that keyword is highlighted.
- The complete list of all FANTOM5 CAGE data samples is accessible in the Google SpreadSheet.
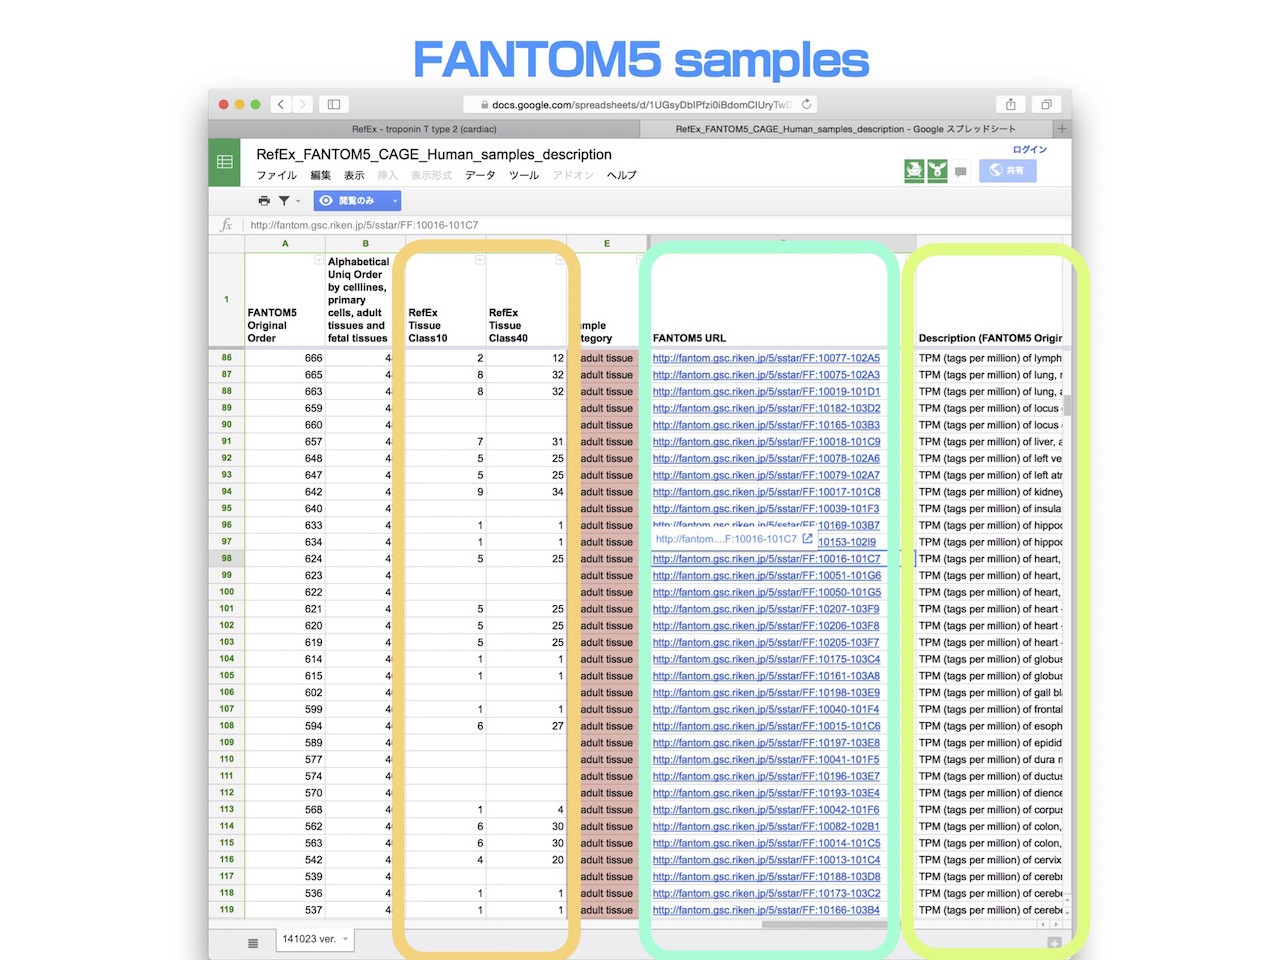
- The FANTOM5 CAGE data hold correspondence to tissue classification in the original RefEx, and link back to the original FANTOM5 data.
- Expression values of samples obtained in the FANTOM5 project are averaged and listed in RefEx.
- When you click the link destination URL, you can go to the corresponding web page of FANTOM5(as shown in the example below).
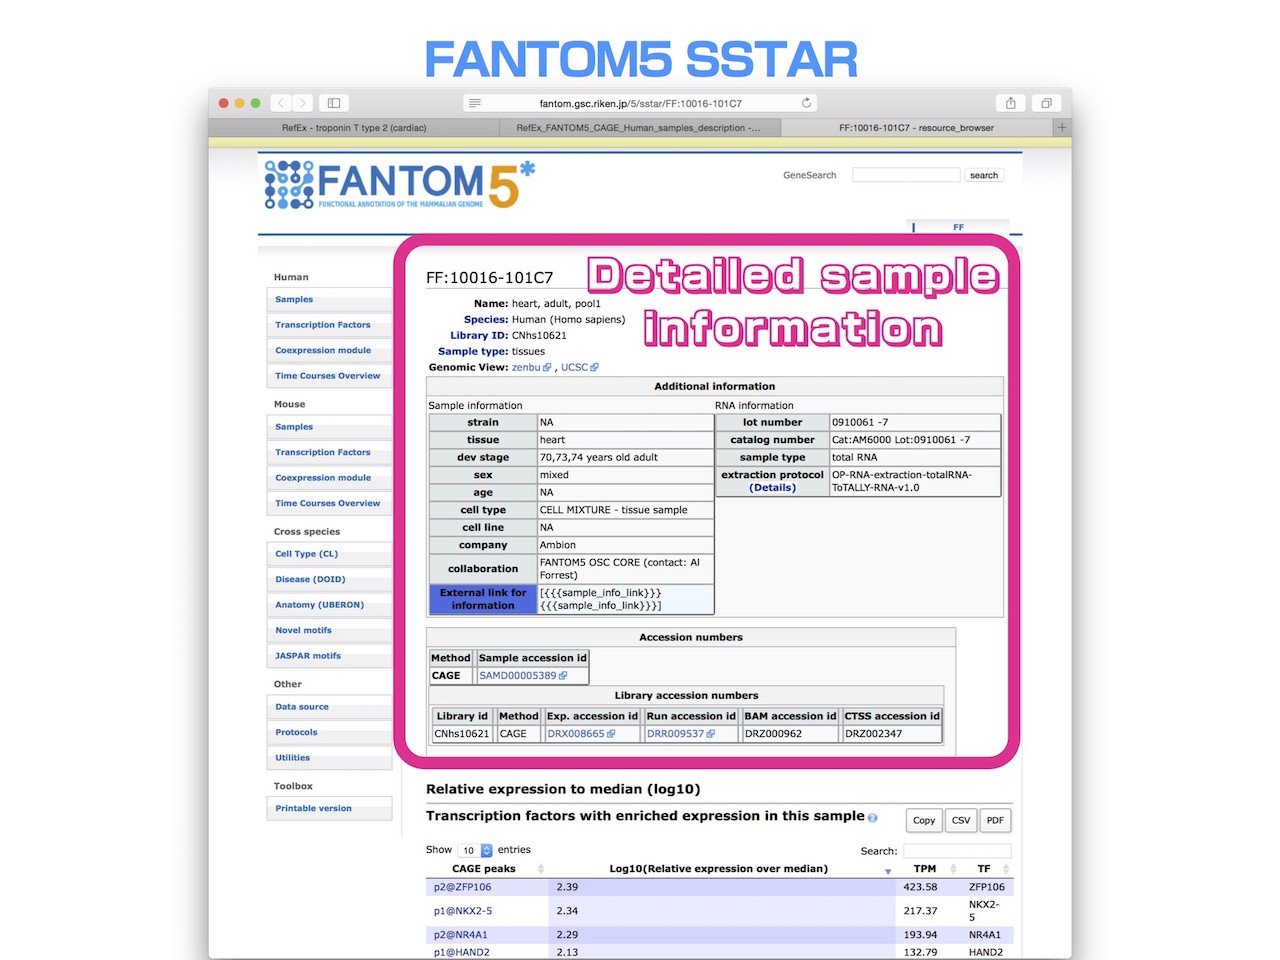
- You can trace a detailed sample information of expression data of FANTOM5 that can be viewed on RefEx.
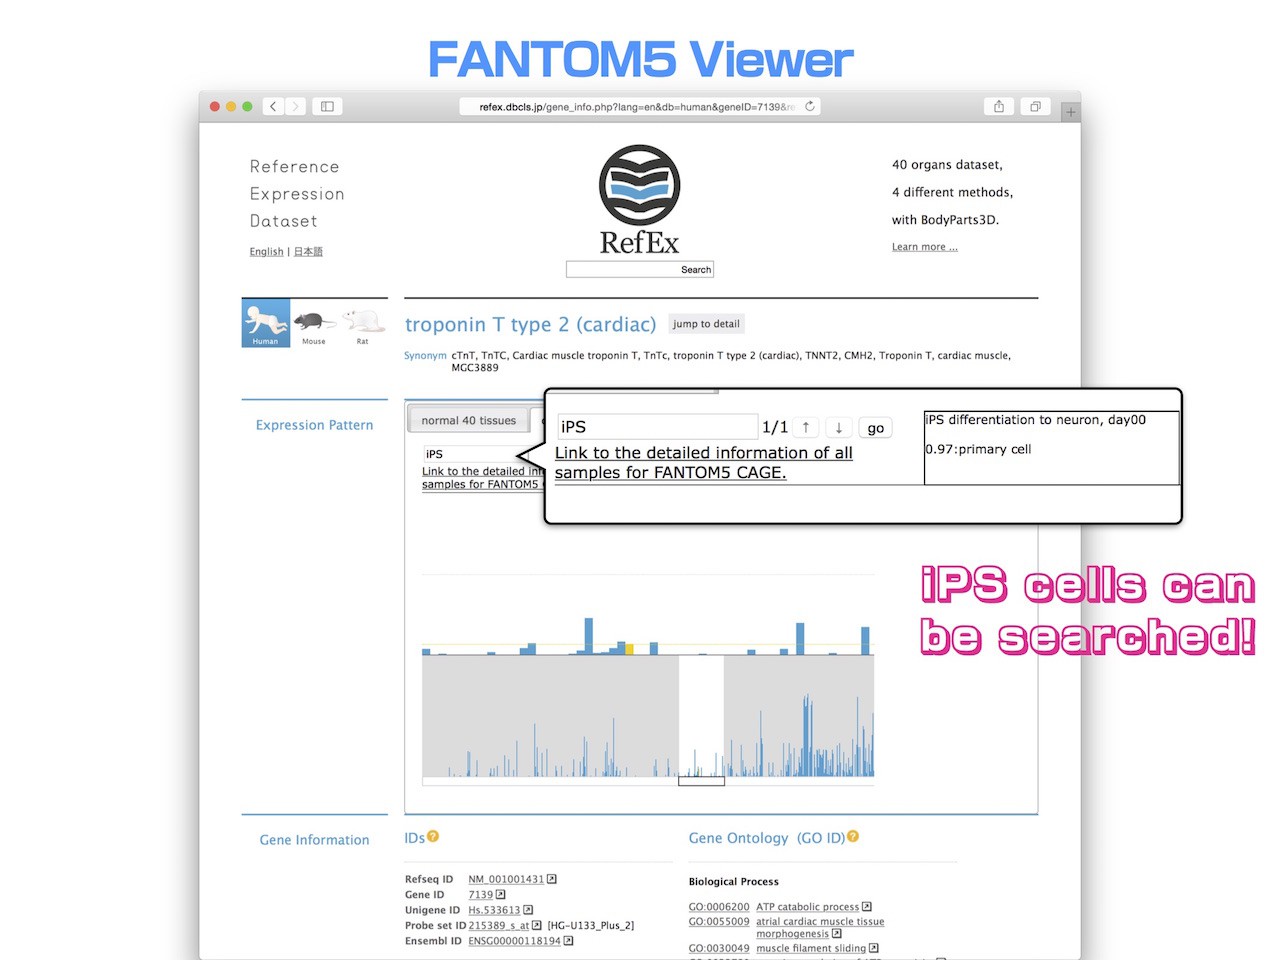
- Perhaps the most important benefit of the FANTOM5 CAGE data is that search targets are now much more abundant.
- An example of the search for iPS cells is shown here.
- Unfortunately, this gene does not seem so much expression in iPS cells.
- The original version of RefEx only had 40 tissue search targets. However, it is now possible to search against more than five hundred human samples, encompassing cell lines, primary cells, and adult and fetal tissues.
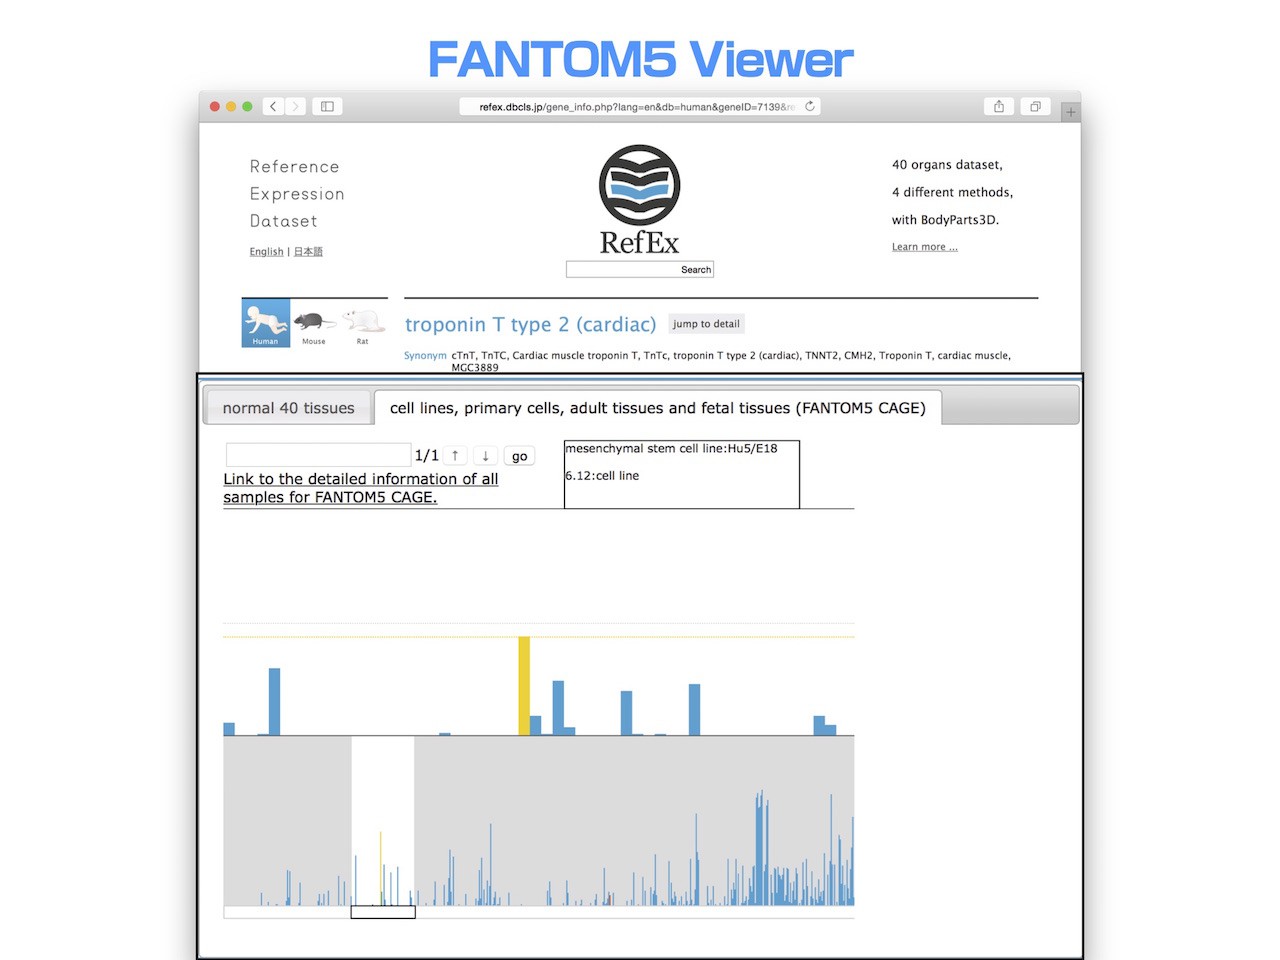
- Furthermore, when you examined the cell lines that this gene was highly expressed.
- You can see that it is the myoblast cell line Hu5 / E18.
Search for the Tissue-specific Genes
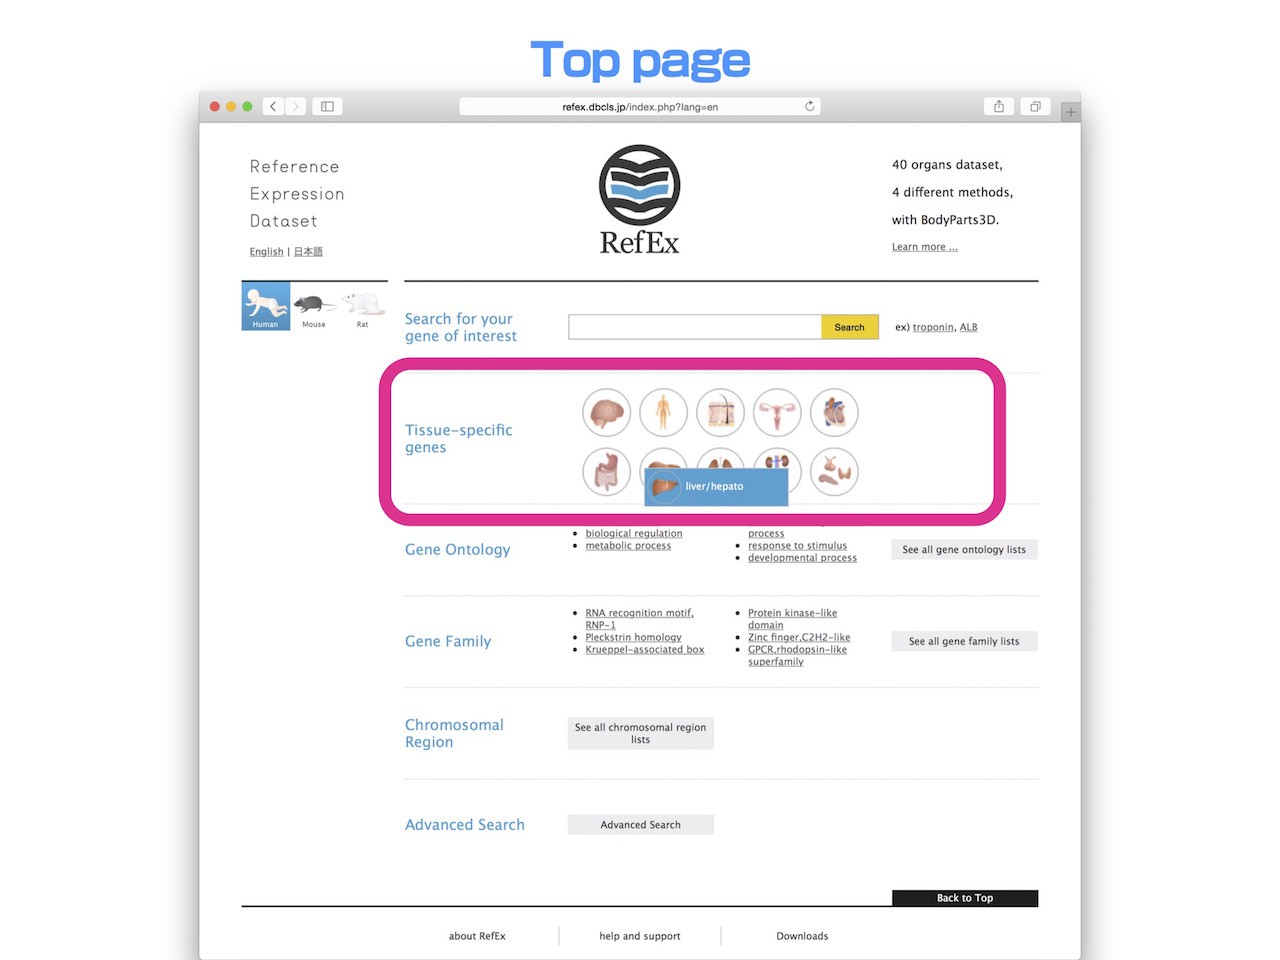
- Clicking the tissue icons on the RefEx top page easily retrieves genes with tissue specific expression patterns.
- When you move the mouse cursor to the tissue icon of the top page, you can see that each tissue of 40 classifications. Then choose the tissue you want to examine.
- This time, we'll explain liver as an example.
- Then, you will find genes that are highly expressed only in liver.
- RefEx contains unique lists of genes whose expression pattern is prominent in a specific tissue compared with other tissues. Those genes with tissue specific expression patterns are calculated for all tissues using the ROKU method (Kadota et al., BMC Bioinformatics, 2006, 7:294).
- ROKU was developed solely for this purpose. It ranks genes according to their overall tissue specificity using Shannon entropy, and detects tissues specific to each gene, if any exist, using an outlier detection method.
Search Filters
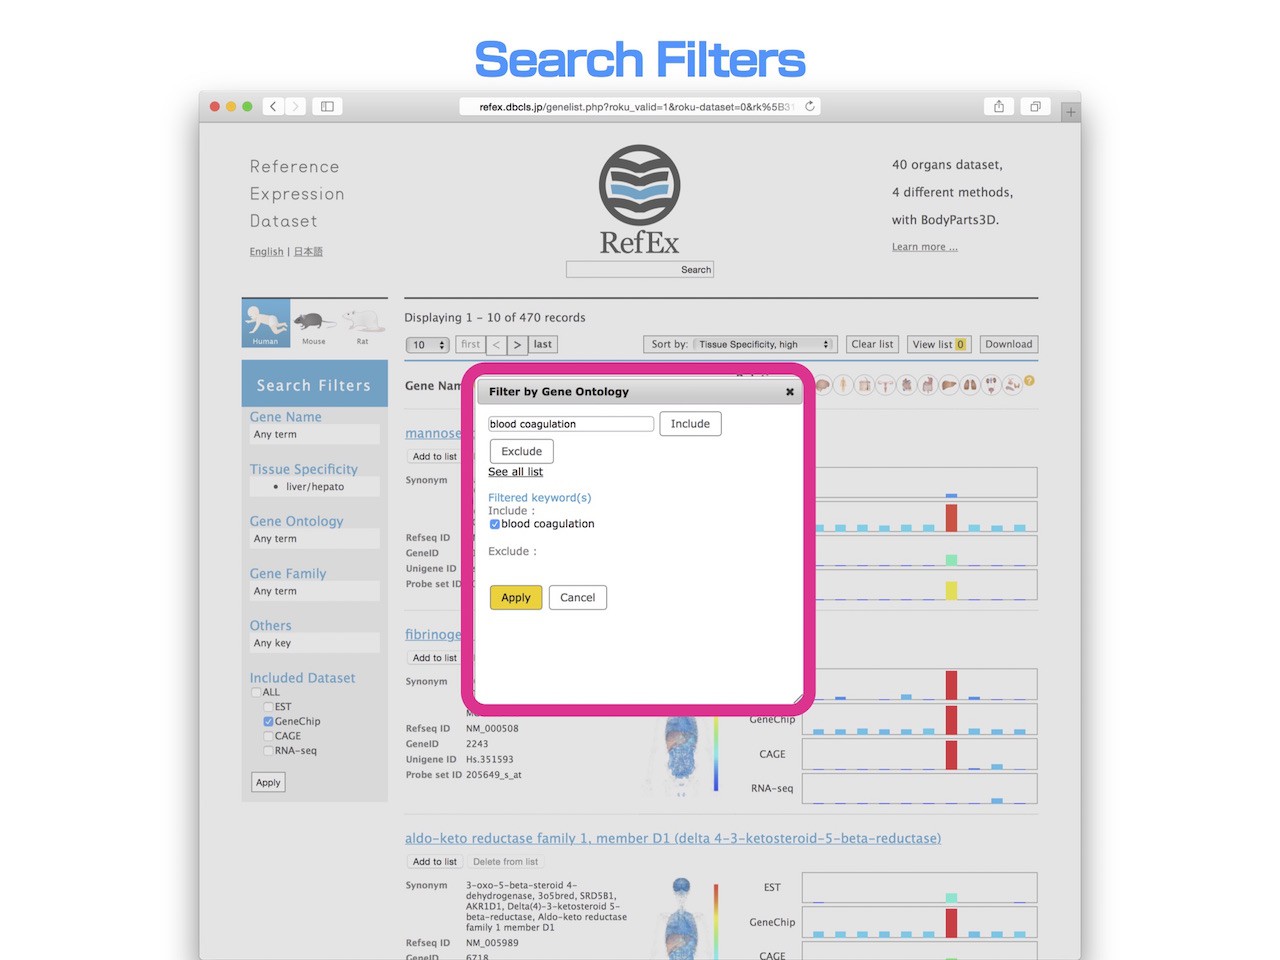
- When you use the "Search Filter" in the left side of "Search Results" page, you can narrow down the search results.
- This time, the retrieved liver-specific genes are 470 records. Let's narrow down only to gene having a function of "Blood coagulation".
- In the "Search Filter", you can narrow down by Gene Ontology term, and specify a Go term called "Blood coagulation" to "Include" condition.
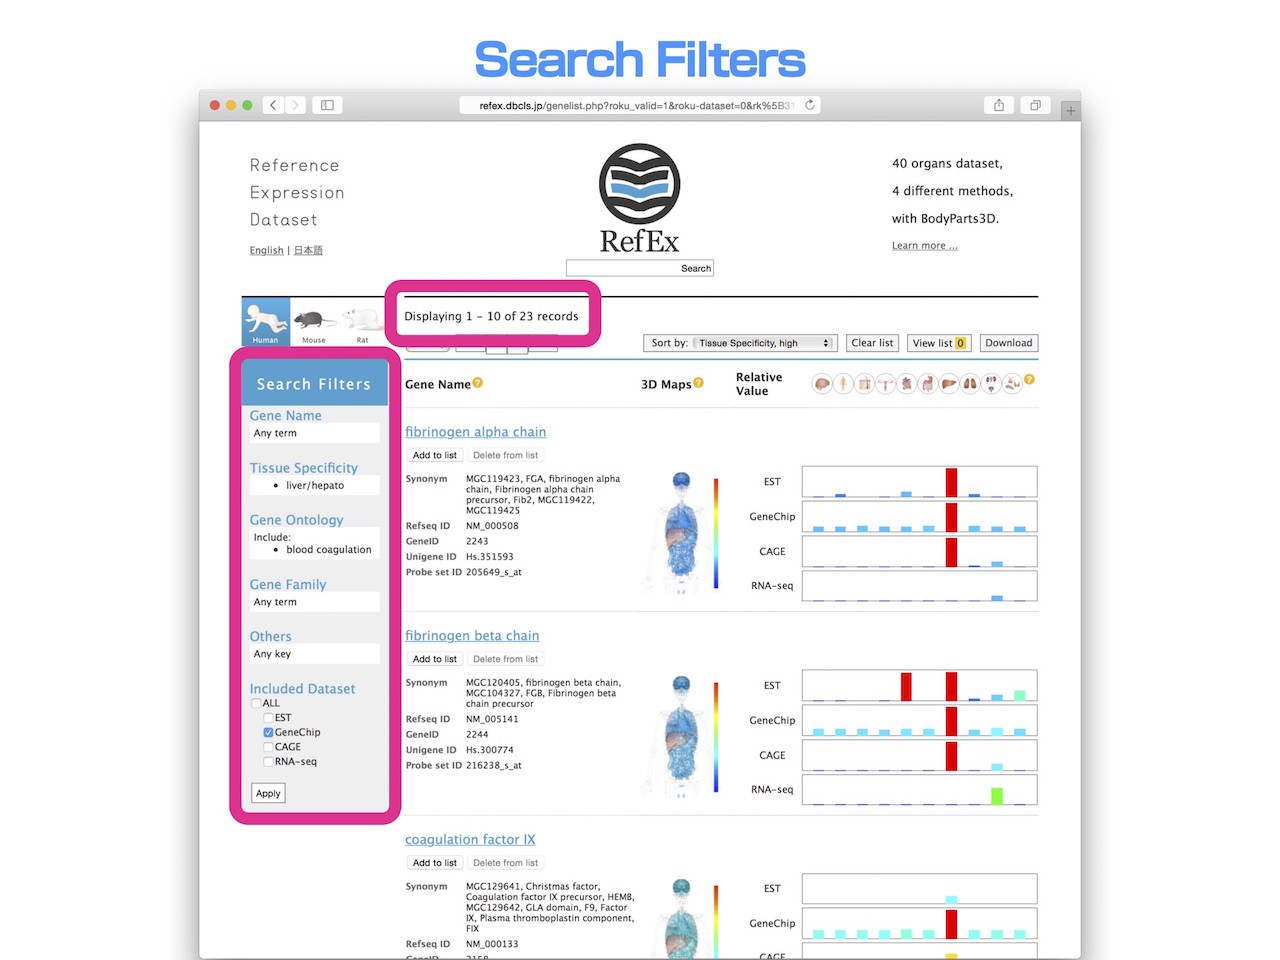
- By doing this, you can see that there are 23 genes that have a Go term of "Blood Coagulation" in the liver-specific genes.
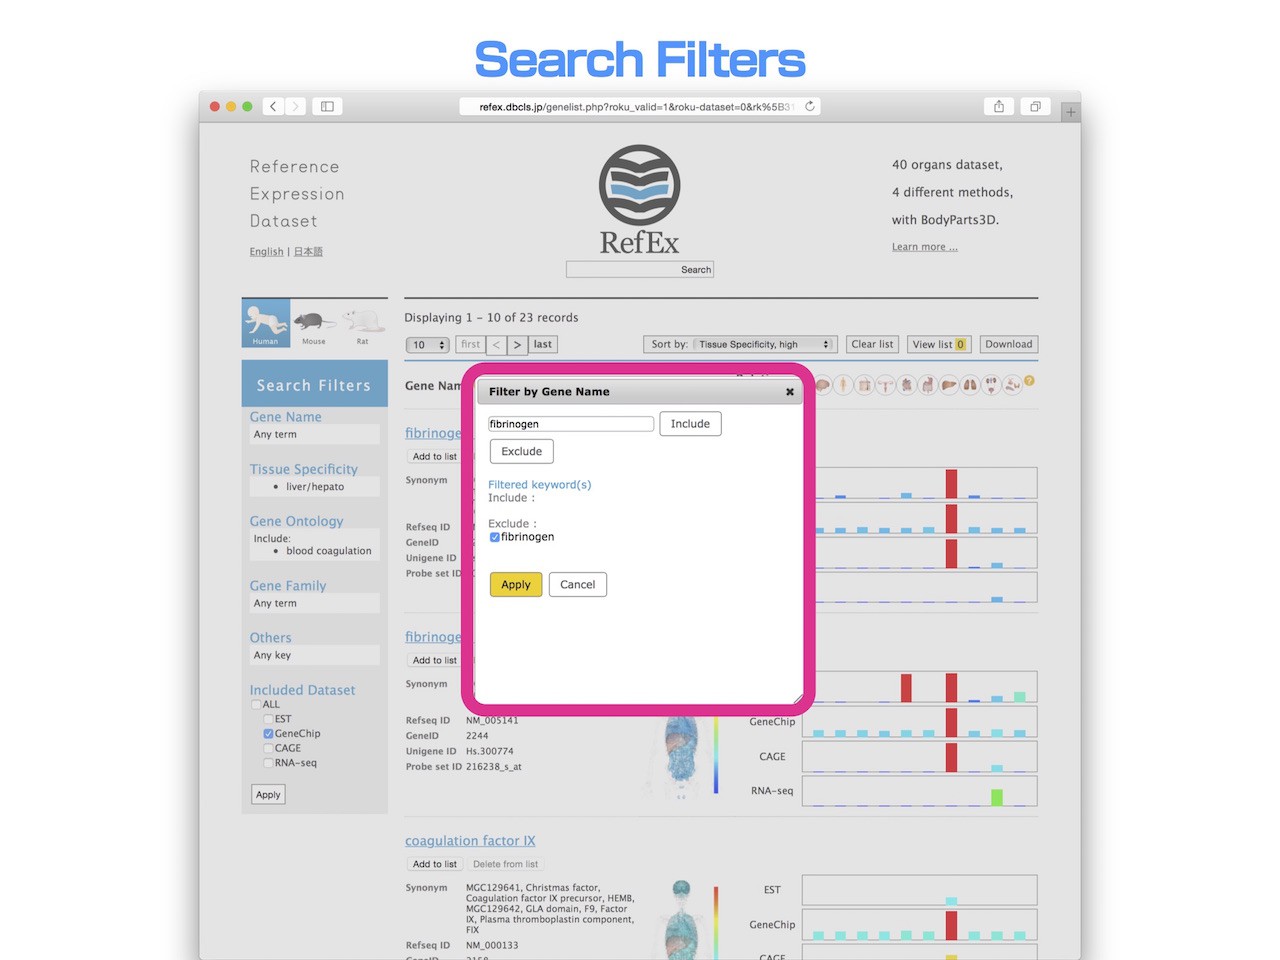
- In addition, from this, in order to narrow down the genes that do not include the "fibrinogen" from the gene name, it is specified in the "exclude" filters.
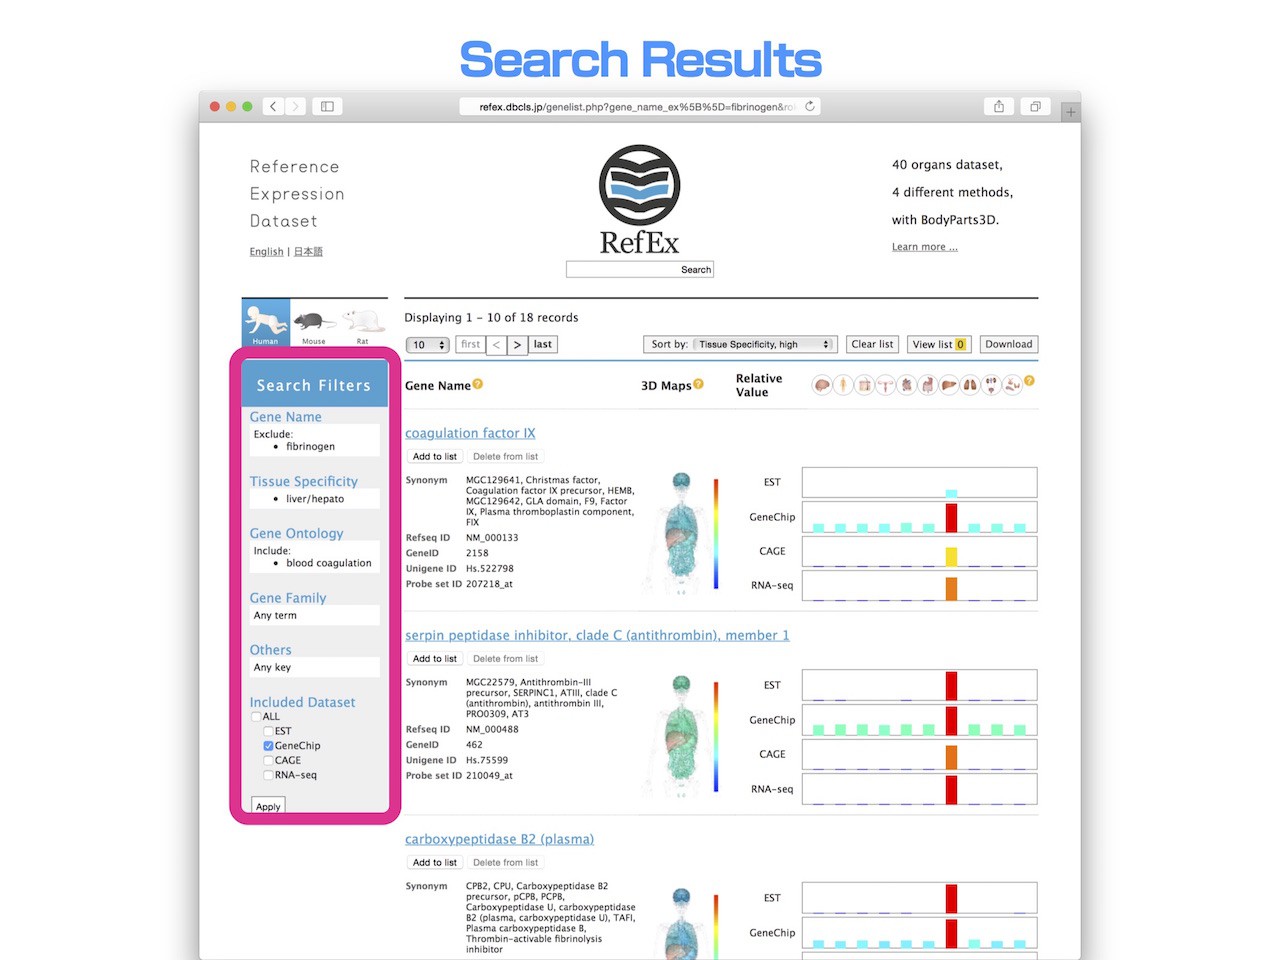
- In this way, using the "Search filters", you can easily display the genes that liver specifically expressed, associated with the "Blood coagulation" and other than fibrinogen.
Sorting
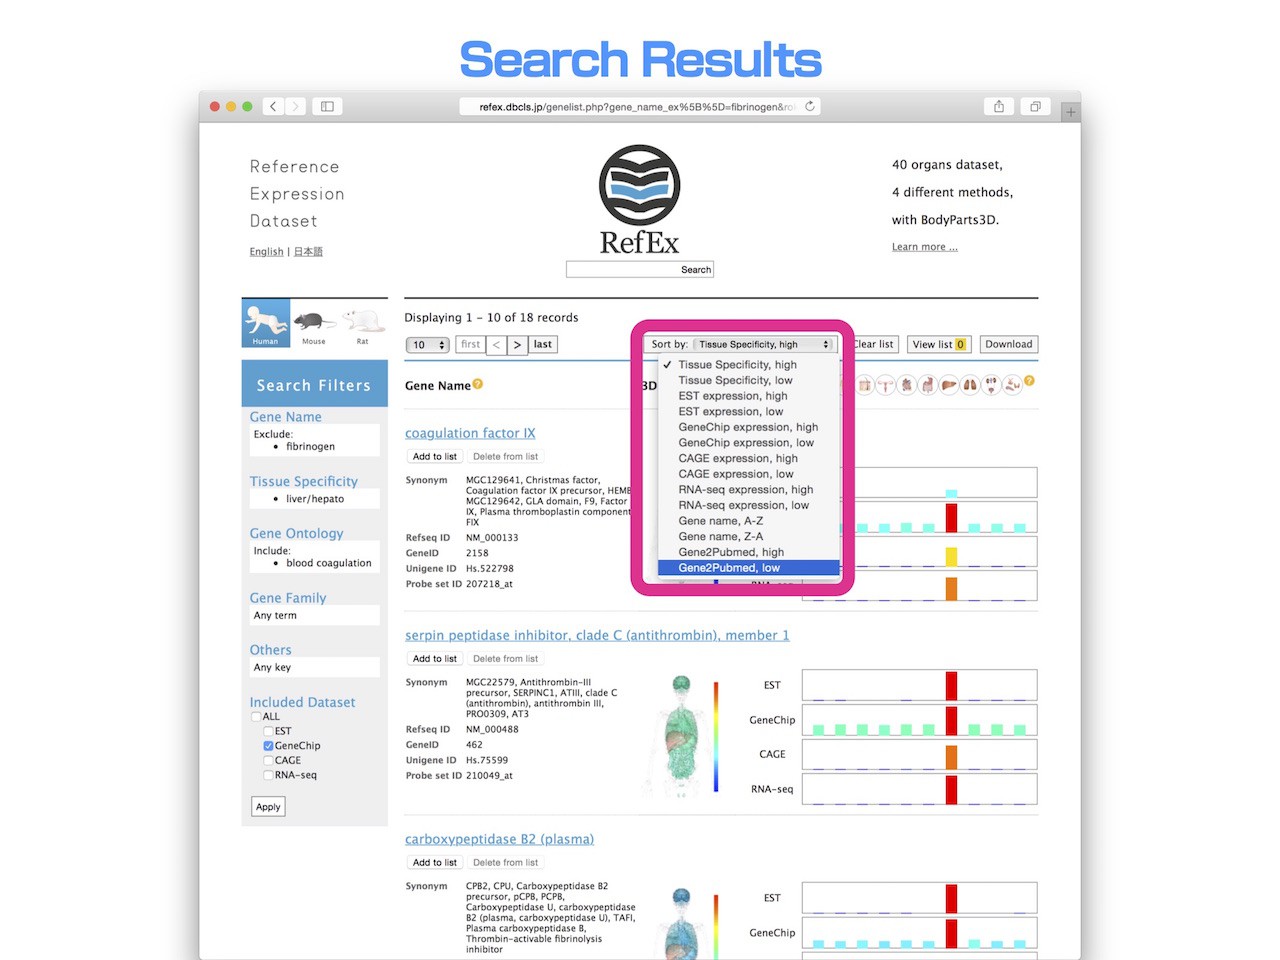
- Users can easily change the order of genes in the list using a variety of expression values and gene names, while the default gene list order is sorted by tissue specificity from the ROKU method.
- The most prominent usage of this sorting is to utilize the "gene2pubmed" dataset and the manually curated “gene to PubMed literature” relationship dataset provided by NCBI. Furthermore, sorting genes by the number of corresponding literature citations in PubMed enables a user to sort by whether a gene is ‘famous’ or not.
- This option enables users to discover promising genes of unknown function.
List Function
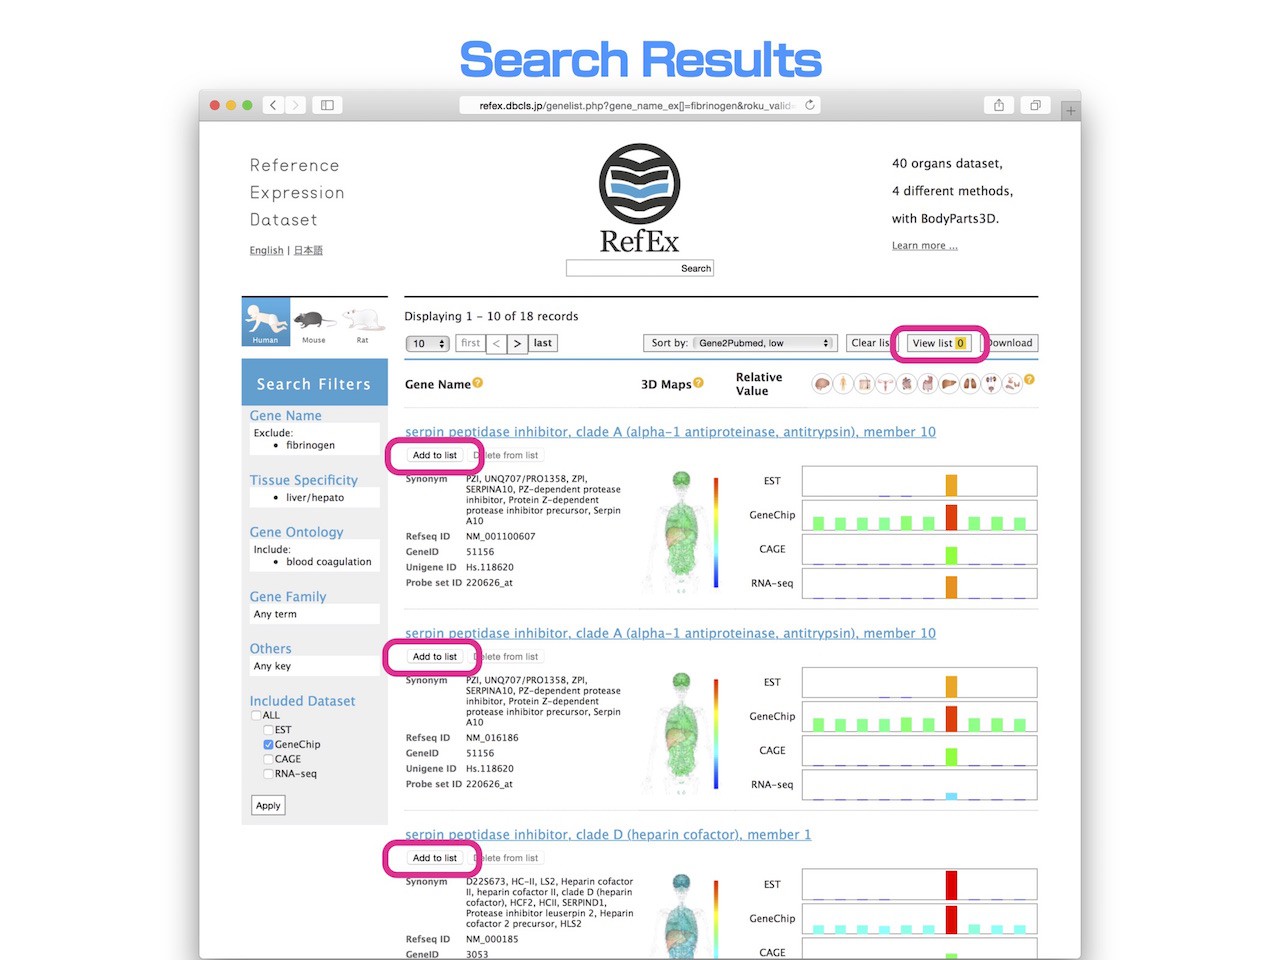
- Using the "list" function, you can compare the data of the "detailed Information" page in parallel.
- When you press the "Add to list" button under the each gene name, gene will be added to the list, and then the number is shown next to the "View list".
Gene List
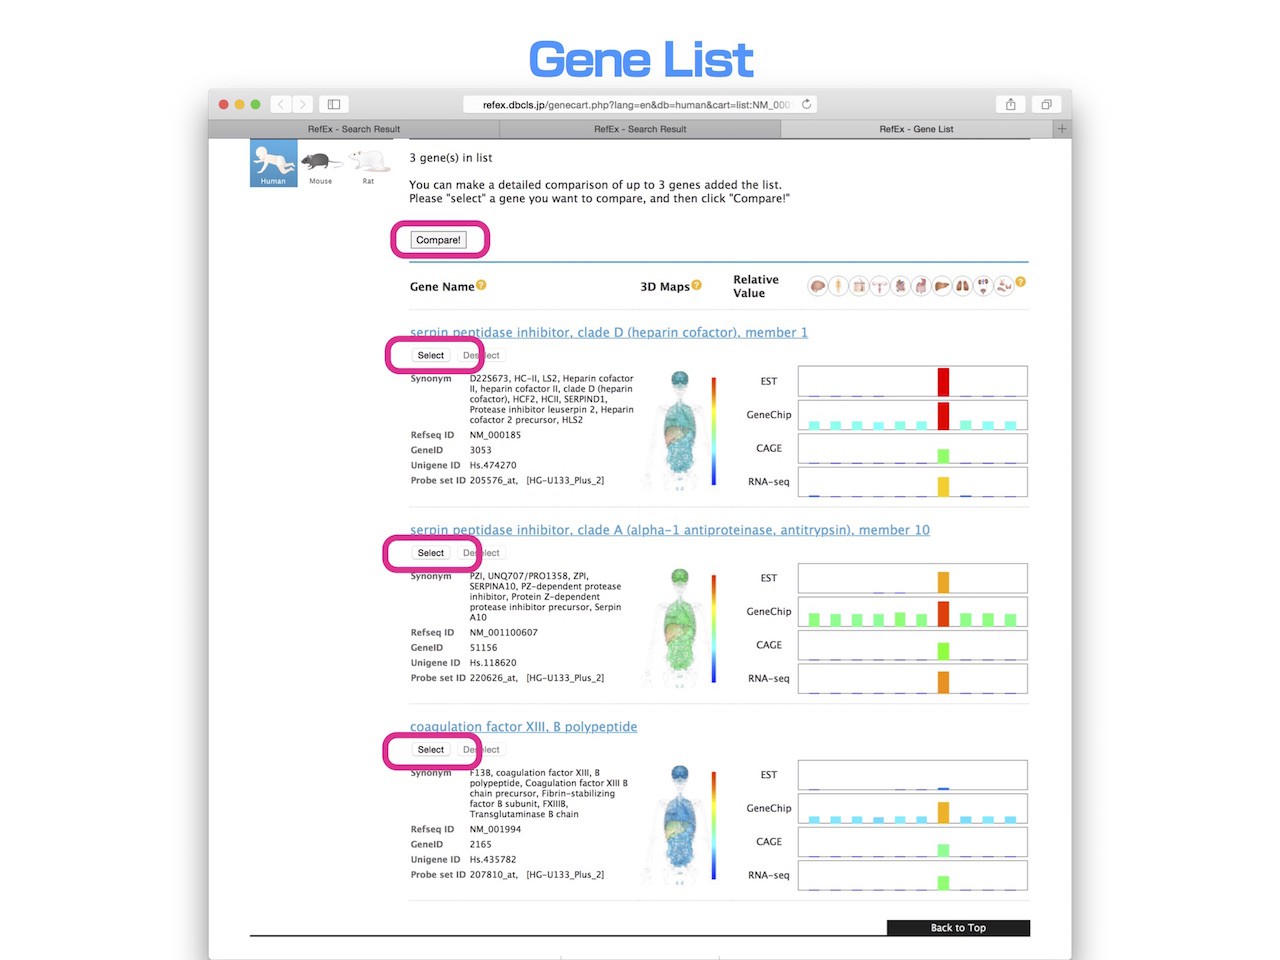
- Genes that have been added to the list can be compared up to three at the same time.
- Select the gene you want to compare, and then press the "Compare" button.
Comparison View
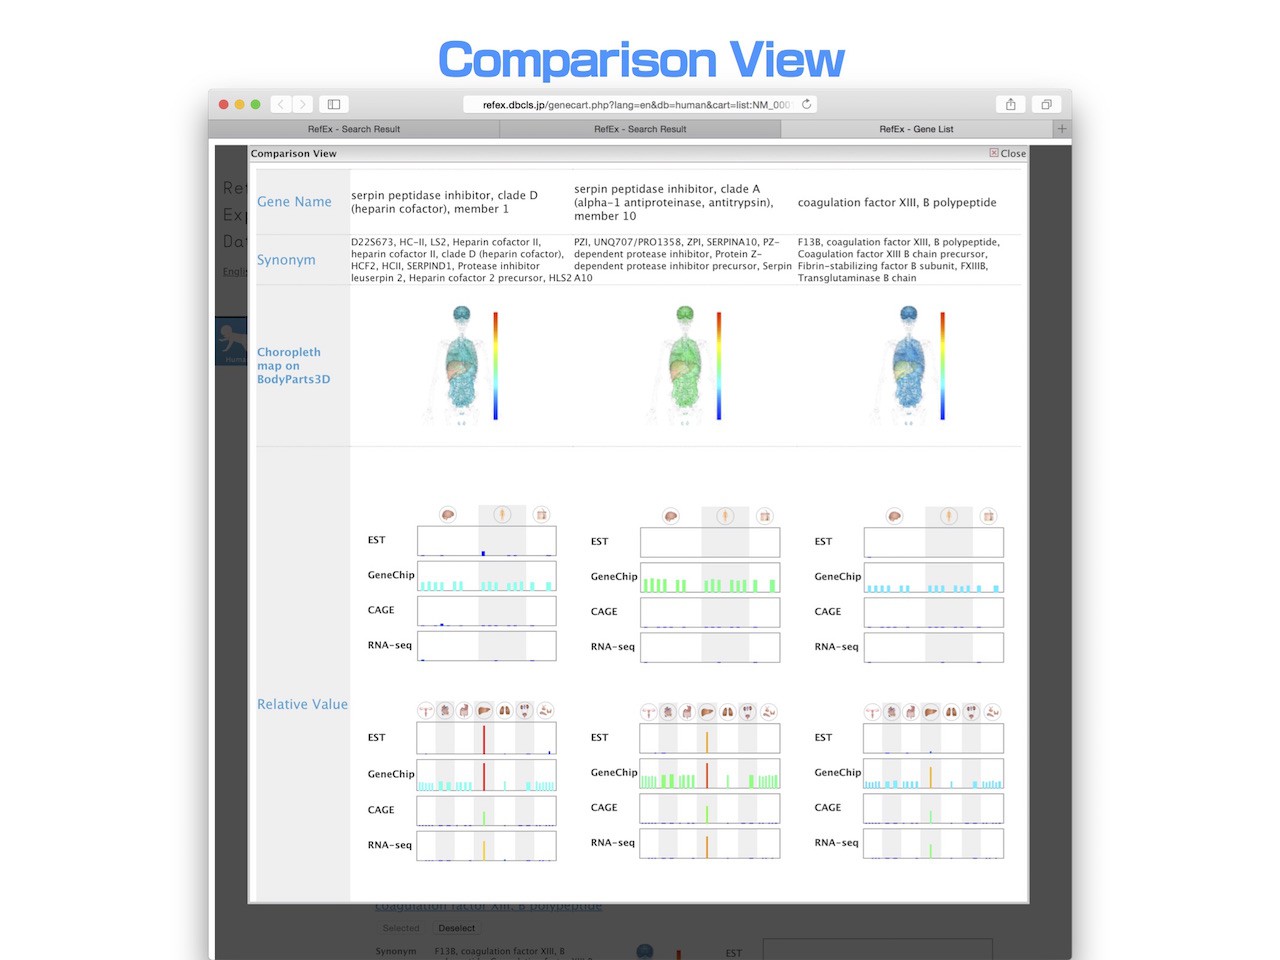
- Up to three genes that have been added to a user’s list can be compared at the same time. Users can compare all the detailed information about genes in that list, including expression data, in parallel. This enables users to easily find differences among the genes.
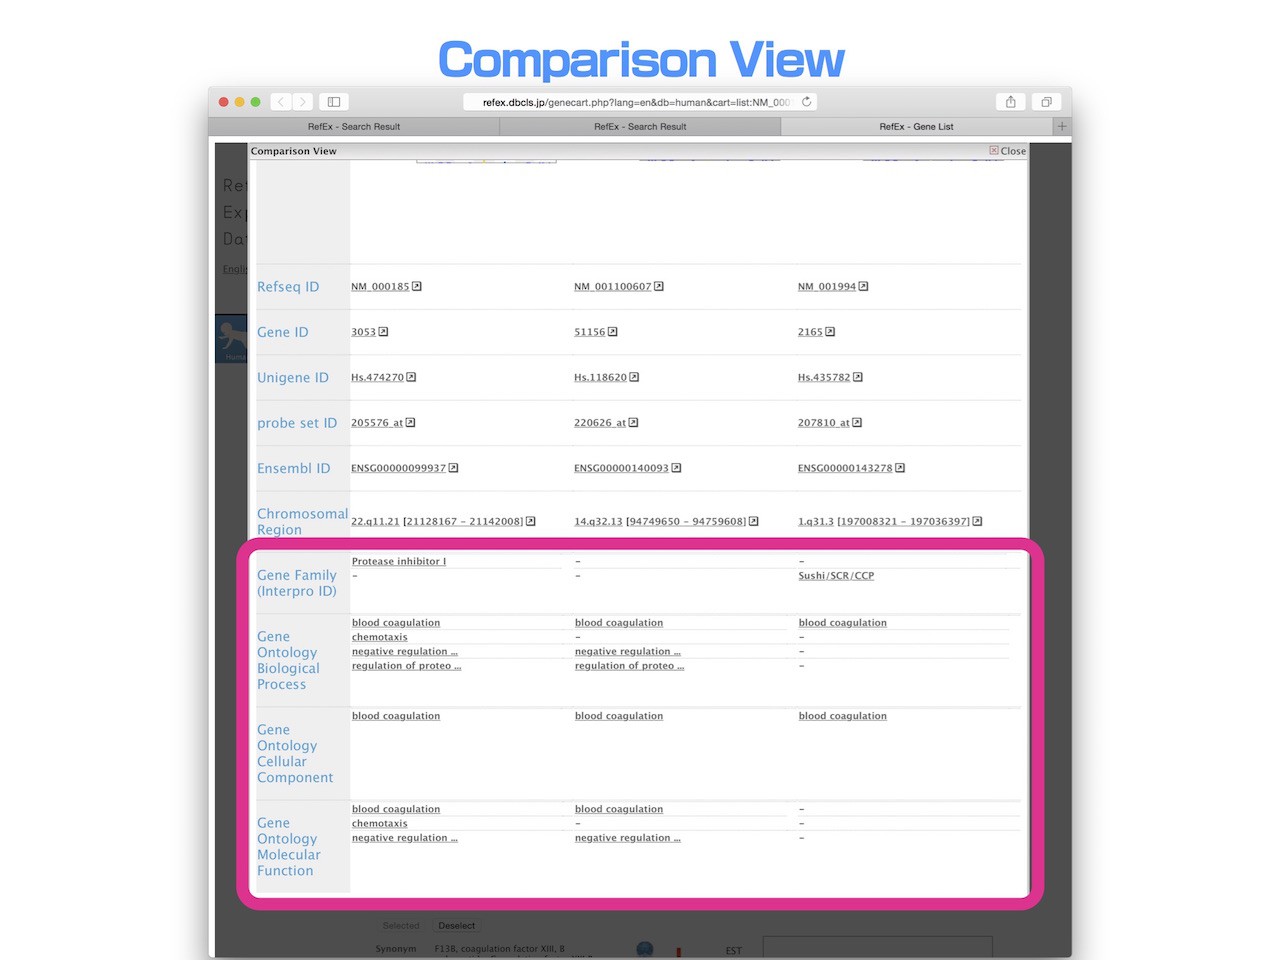
- Overlapped terms, such as Gene Ontology and InterPro gene family, are arranged in the same row.
- In this way, RefEx is also useful as a tool for investigating the relationships of unknown genes found in gene expression analyses.